Setup Monitoring with Prometheus, Grafana, and node_exporter.

Server uptime and stability are pillars of a successful infrastructure design, and downtime is always painful if you spend time working on IT infrastructure. Monitoring is one way to prevent anomalies and help keep your servers running optimally.
There are many options to monitor your servers, ranging from one-script setup-ready solutions like Netdata and more complex options dedicated to monitoring your web servers, database, or even file-integrity monitoring solution with something like OSSEC.
But, for now, we will set up a monitoring stack consisting of Prometheus, Grafana, and node_exporter.
We chose this program selection because it was the most widely supported and popular monitoring tool, and I even use it daily at the place I work to monitor hundreds of endpoints.
Thinking Ahead
In this tutorial, we are going to achieve setting up monitoring for 2 nodes (web server, and database) resulting in a setup looking like this:
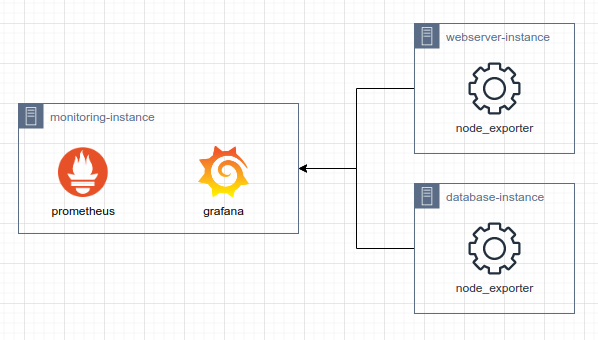
I'll keep this tutorial as production-ready as possible, and we will use Ubuntu 22.04 LTS for every node.
Setting up Prometheus
After connecting to your monitoring instance, we need to get the package for installation.
Use the following command below, or check the Prometheus website for the latest version.
wget https://github.com/prometheus/prometheus/releases/download/v2.37.0/prometheus-2.37.0.linux-amd64.tar.gzAfter downloading the package, extract the packages using the following command:
tar xvf prometheus*.tar.gzNavigate to the extracted folder, and move the executable to the bin directory with the following command:
cd prometheus*/
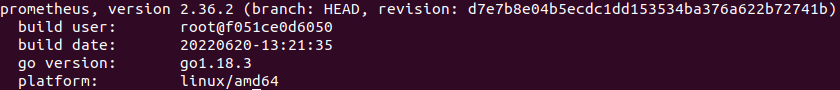
sudo mv prometheus promtool /usr/local/bin/Validate the installed version by executing prometheus --version and the result should look like this:
Next, we will create folders for Prometheus to store configuration and storage data, and execute the following command:
sudo mkdir /etc/prometheus /var/lib/prometheus/
sudo chown -R prometheus:prometheus /etc/prometheus /var/lib/prometheus/
sudo mv prometheus.yml /etc/prometheus/prometheus.yml
sudo mv consoles/ console_libraries/ /etc/prometheus/
To make Prometheus run as a service, we will create a dedicated user and group for it:
sudo groupadd --system prometheus
sudo useradd -s /sbin/nologin --system -g prometheus prometheus
After creating the users, let's make a new systemd service:
sudo nano /etc/systemd/system/prometheus.servicePut the following code inside the file:
[Unit]
Description=Prometheus
Documentation=https://prometheus.io/docs/introduction/overview/
Wants=network-online.target
After=network-online.target
[Service]
User=prometheus
Group=prometheus
Type=simple
ExecStart=/usr/local/bin/prometheus \
--config.file /etc/prometheus/prometheus.yml \
--storage.tsdb.path /var/lib/prometheus/ \
--web.console.templates=/etc/prometheus/consoles \
--web.console.libraries=/etc/prometheus/console_libraries

[Install]
WantedBy=multi-user.target
Reload systemd and enable the service:
sudo systemctl daemon-reload
sudo systemctl enable --now prometheus
Validate the service is running by executing the following command:
sudo service prometheus status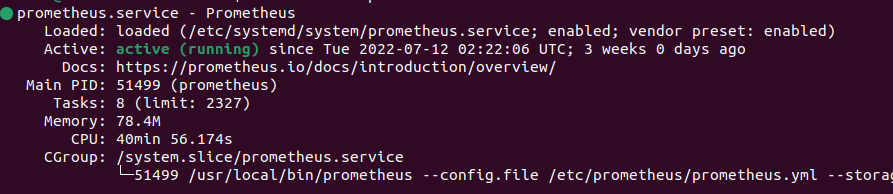
If the output showed that the service is active, congrats you have learned how to set up Prometheus, and now we'll go to the next step.
Setting up Grafana
We start installing grafana by adding the private key to the repositories, and executing the following command:
wget -q -O - https://packages.grafana.com/gpg.key | sudo apt-key add -After that, we add the following stable repositories:
echo "deb https://packages.grafana.com/oss/deb stable main" | sudo tee -a /etc/apt/sources.list.d/grafana.listUpdate the repository and start installing Grafana:
sudo apt update && sudo apt install grafanaEnable the services at startup and start it:
sudo systemctl enable --now grafana-server.serviceSetting up node_exporter
Follow this guide on each of your instances, we start by downloading the required executable:
wget https://github.com/prometheus/node_exporter/releases/download/v1.3.1/node_exporter-1.3.1.linux-amd64.tar.gzExtract the downloaded file:
tar -xvf node_exporter-1.3.1.linux-amd64.tar.gz && cd node_exporter-1.3.1.linux-amd64Make the file executable and move the file to install it:
sudo mv node_exporter /usr/bin/Create an empty configuration file for us to configure later:
sudo touch /etc/node_exporter.confCreate a specific user for node_exporter to run as:
sudo groupadd --system node_exporter
sudo useradd -s /sbin/nologin --system -g node_exporter node_exporter
Create a new service file for node_exporter:
sudo nano /etc/systemd/system/node-exporter.service[Unit]
Description=Node Exporter
[Service]
User=node_exporter
Group=node_exporter
EnvironmentFile=/etc/node_exporter.conf
ExecStart=/usr/bin/node_exporter $OPTIONS
[Install]
WantedBy=multi-user.targetEnable the service:
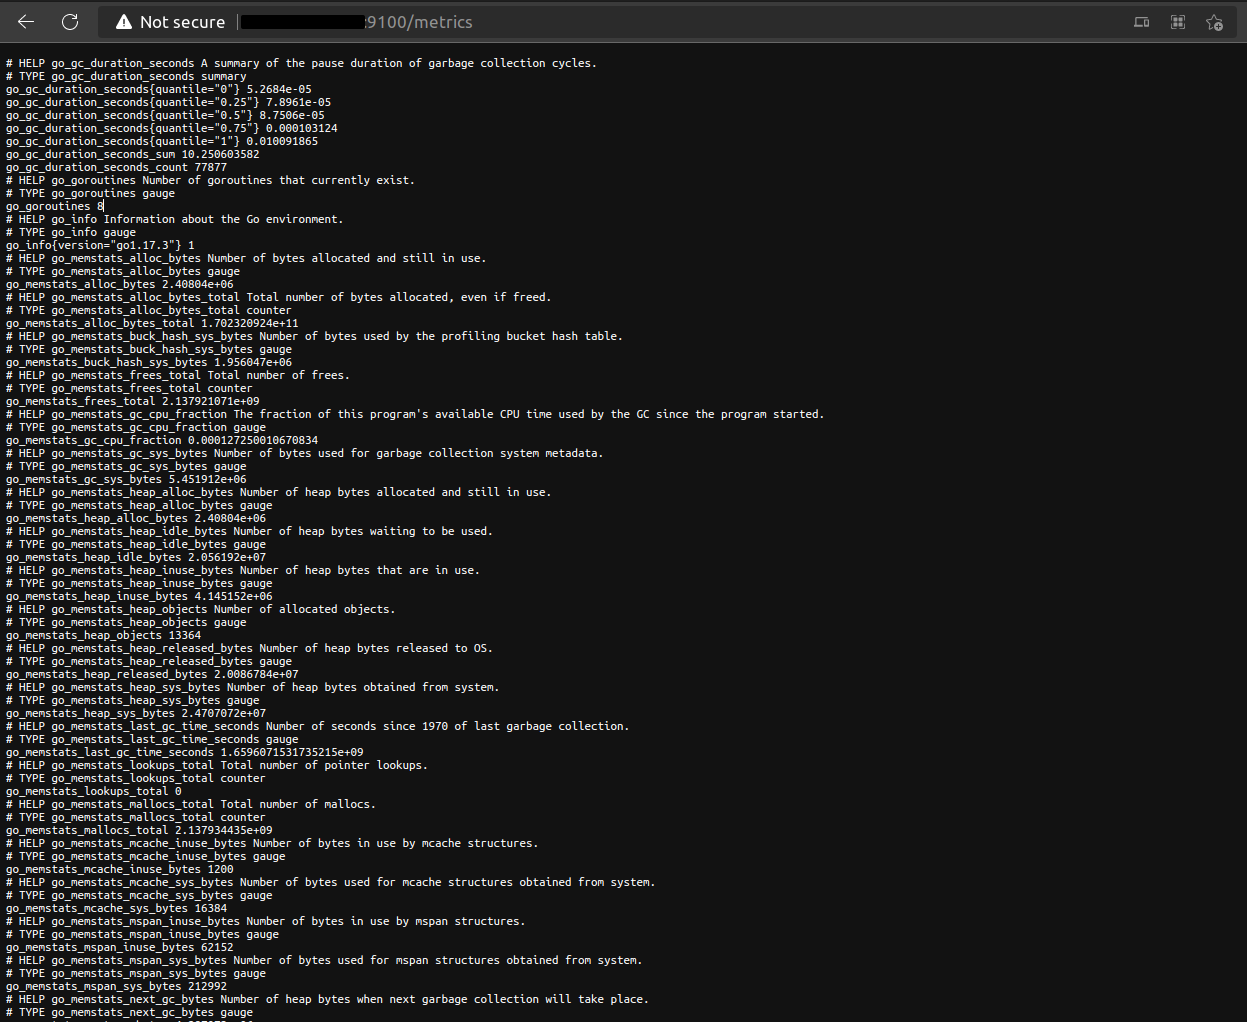
sudo systemctl enable --now node-exporterCheck the service started, and you can begin to access it via:
http://your_server_name_or_ip:9100/metrics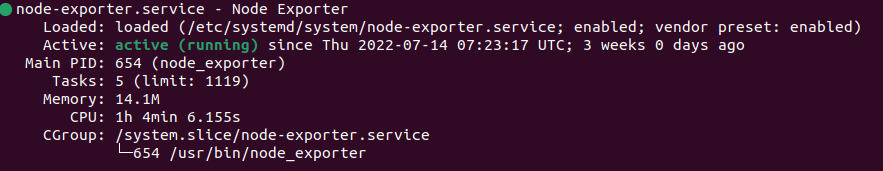
Configuring Prometheus with node_exporter
On your monitoring server, we are going to allow Prometheus to talk with node_exporter, first open the configuration file:
sudo nano /etc/prometheus/prometheus.ymlAdd the following code to the configuration, and don't forget to replace the webserver and database IP address:
scrape_configs:
  - job_name: "prometheus"

    static_configs:
      - targets: ["localhost:9090"]

  - job_name: "node"
    static_configs:
      - targets: ['webserver_ip:9100', 'database_ip:9100']
Restart the Prometheus instance:
sudo service prometheus restartAfter restarting it, you could validate if the node exporter is available and its health status data by accessing:
http://monitoring_instance_ip:9090/targetsSetting up Grafana dashboard
After setting up the entire monitoring stack and its configuration, we finalize our setup by installing a dashboard to monitor your server at a glance.
First, let's login to Grafana by accessing the dashboard:
http://monitoring_instance_ip:3000/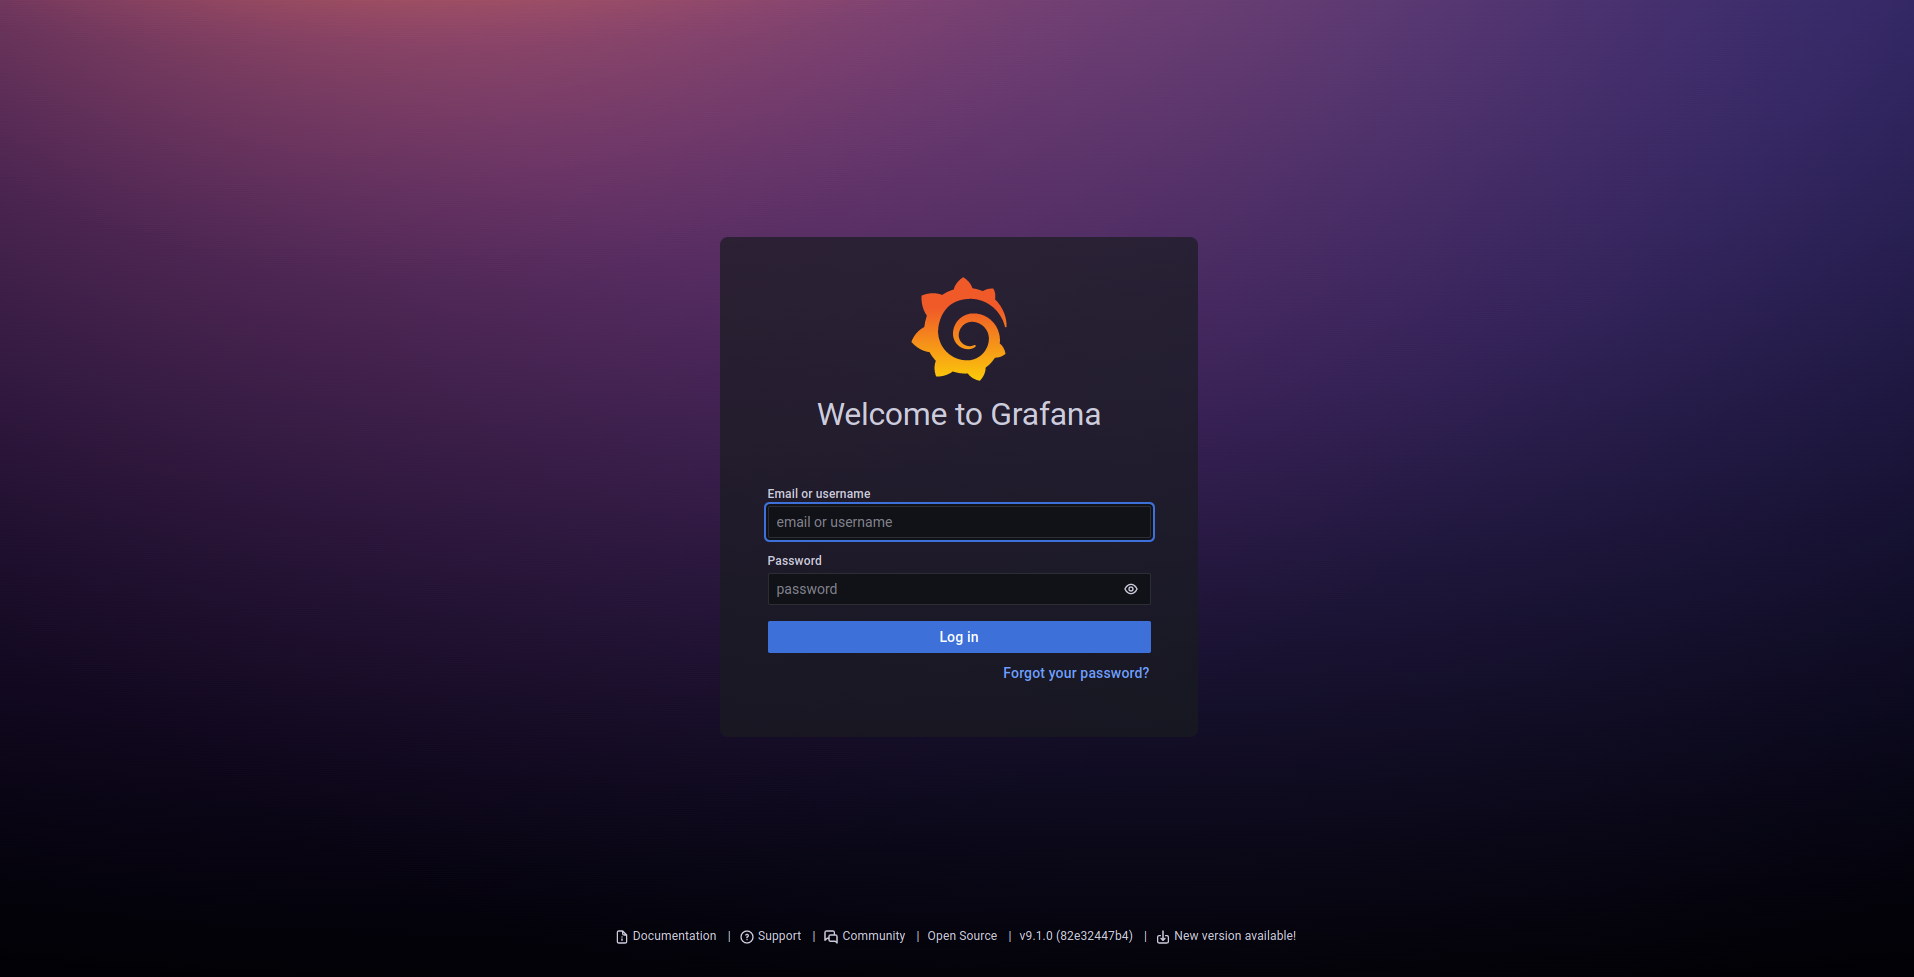
Login with its default credential:
username: admin
password: admin
After, logging in you may be prompted to change your default password, switch to a new password, and continue to the next step.
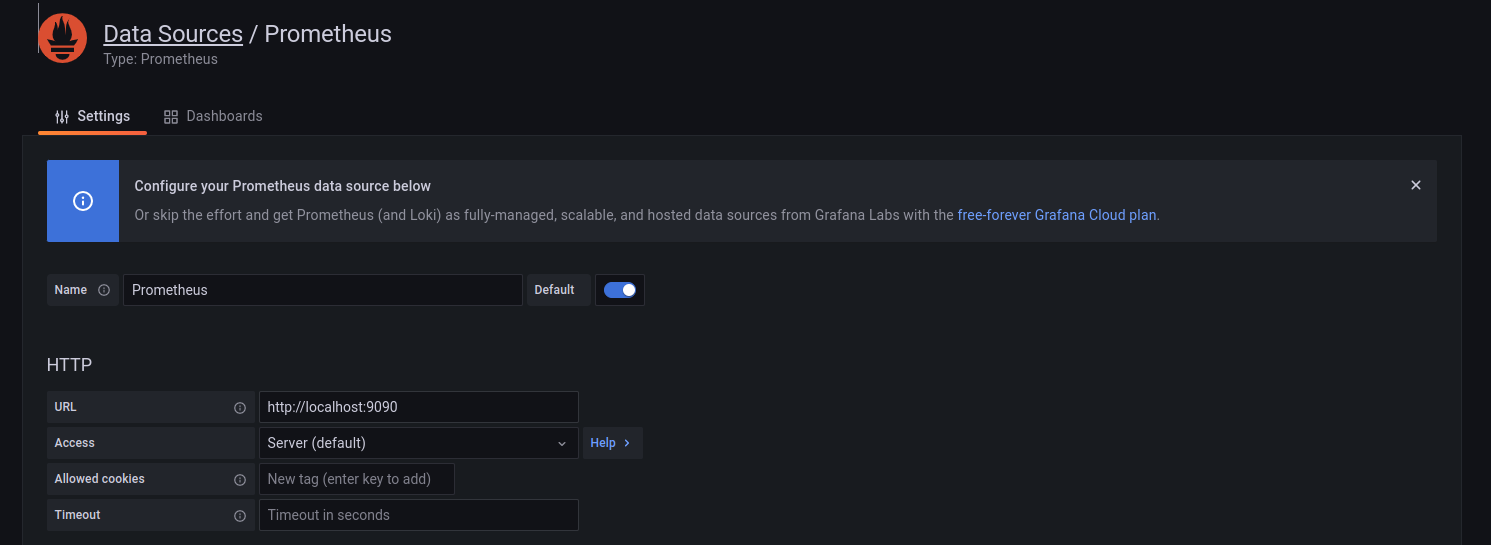
In the panel go to Configuration -> Data Sources and add a new Prometheus source:
Continue setting up by importing a new dashboard created by Ricardo F and we import it by accessing the Dashboard -> + Import page.
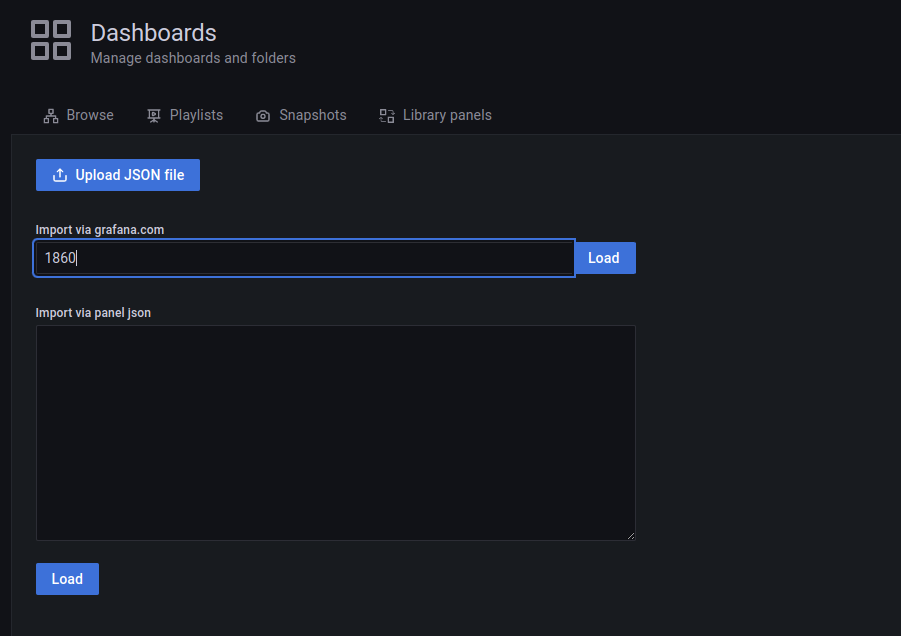
Enter 1860 as the dashboard ID and click Load.
After importing the dashboard, you should be redirected to a new shiny panel consisting of your infrastructure metrics.
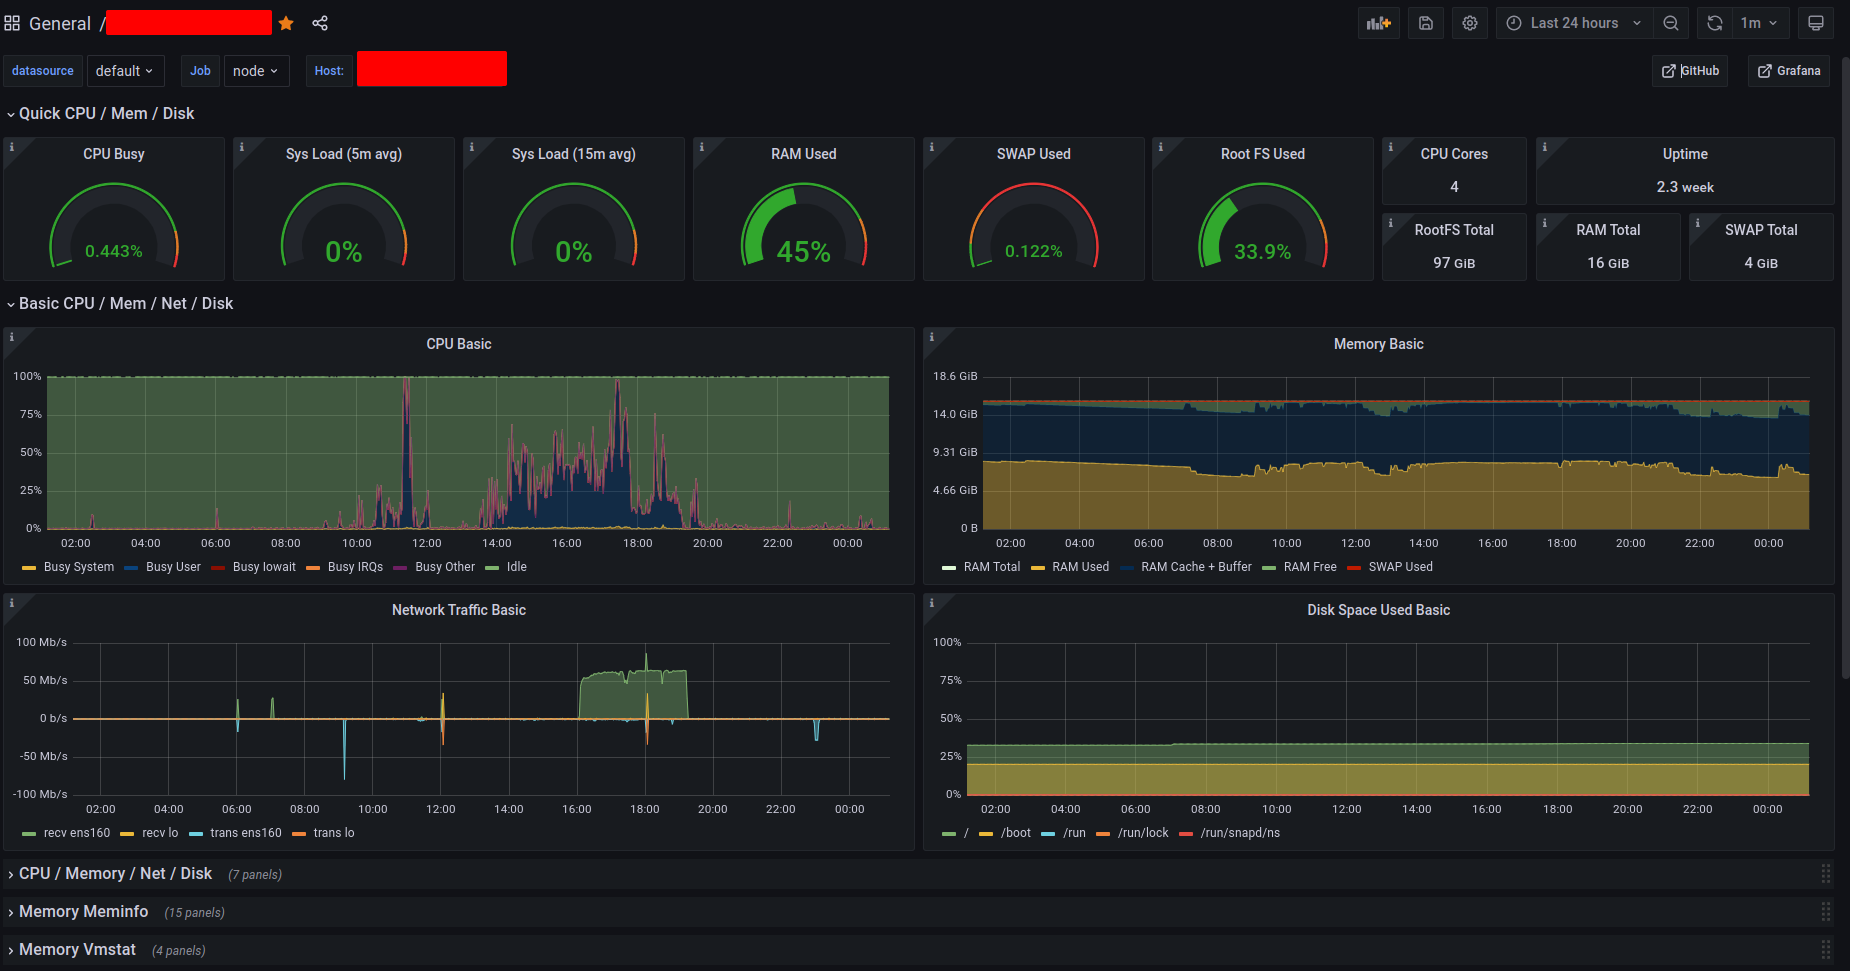
Ta-da!
Congrats, you've learned how to set up a Prometheus monitoring stack.